
October 14, 2016
Mapping Earth’s History with an Eye on the Future
Posted by smaguffin
As part of Earth Science Week, we’ll be highlighting different leaders in the geosciences – from research to education and community outreach. We are posting Q&A’s on The Bridge asking geoscientists about the work they do.
Today’s theme is Geologic Map Day and one of our featured AGU members is Margaret E. Berry. Margaret works for the U.S. Geologic Survey (USGS) and helps to create maps that reveal our planet’s intricate layers. She is part of the National Cooperative Geologic Mapping Program at the USGS Geosciences and Environmental Change Science Center in Lakewood, Colorado. She’s been with the USGS since 2004; prior to that she worked as an Assistant Professor in the Department of Geology at Southern Illinois University, Carbondale. Margaret has a PhD and M.S. in Geology from the University of Colorado Boulder and a B.S. in Geology from Humboldt State University in California.
Could you summarize your job in a sentence or two?
I study the subtle differences among rocks and identify those differences on a map. Different sections of rocks are color coded by their age, origin and composition. I specialize in mapping loose sediments that have not yet compacted into rocks, including sediments from rivers and streams, sand dunes, glaciers and landslides.
How are maps and earth science data transforming the world?
Geologic maps, rich with information about natural terrains, advise people on natural resource availability and natural hazard hotspots. They also identify regions prone to sediment erosion and deposition, which can affect water quality, air quality and roadway functionality. The agricultural sector uses geologic maps to better understand how various rock formations will impact soil fertility and crop production. Decision makers use the maps to identify areas vulnerable to hazards in order to better protect public health and safety.
Geologic maps also show how areas are affected by past environmental changes, which can help us better understand what to expect from future changes. The maps are widely available online.
How important is citizen science to your work?
Although the USGS encourages citizen scientists to contribute to the agency, the work I do is highly specialized and requires expertise in identifying geologic features. However, I have learned quite a bit from interacting with landowners who are knowledgeable about their area and can provide valuable insight into the changes they’ve observed.
How important is the work of federal/state science agencies to your job?
The USGS is a federal agency that works closely with state geological surveys. I also regularly use orthoimagery and aerial photographs from the U.S. Department of Agriculture Farm Service Agency; LIDAR (remote sensing) data from the U.S. Geological Survey; digital soil survey data from the USDA Natural Resources Conservation Service; flood map data from the Federal Emergency Management Agency; and subsurface lithologic data from the Colorado Division of Water Resources.
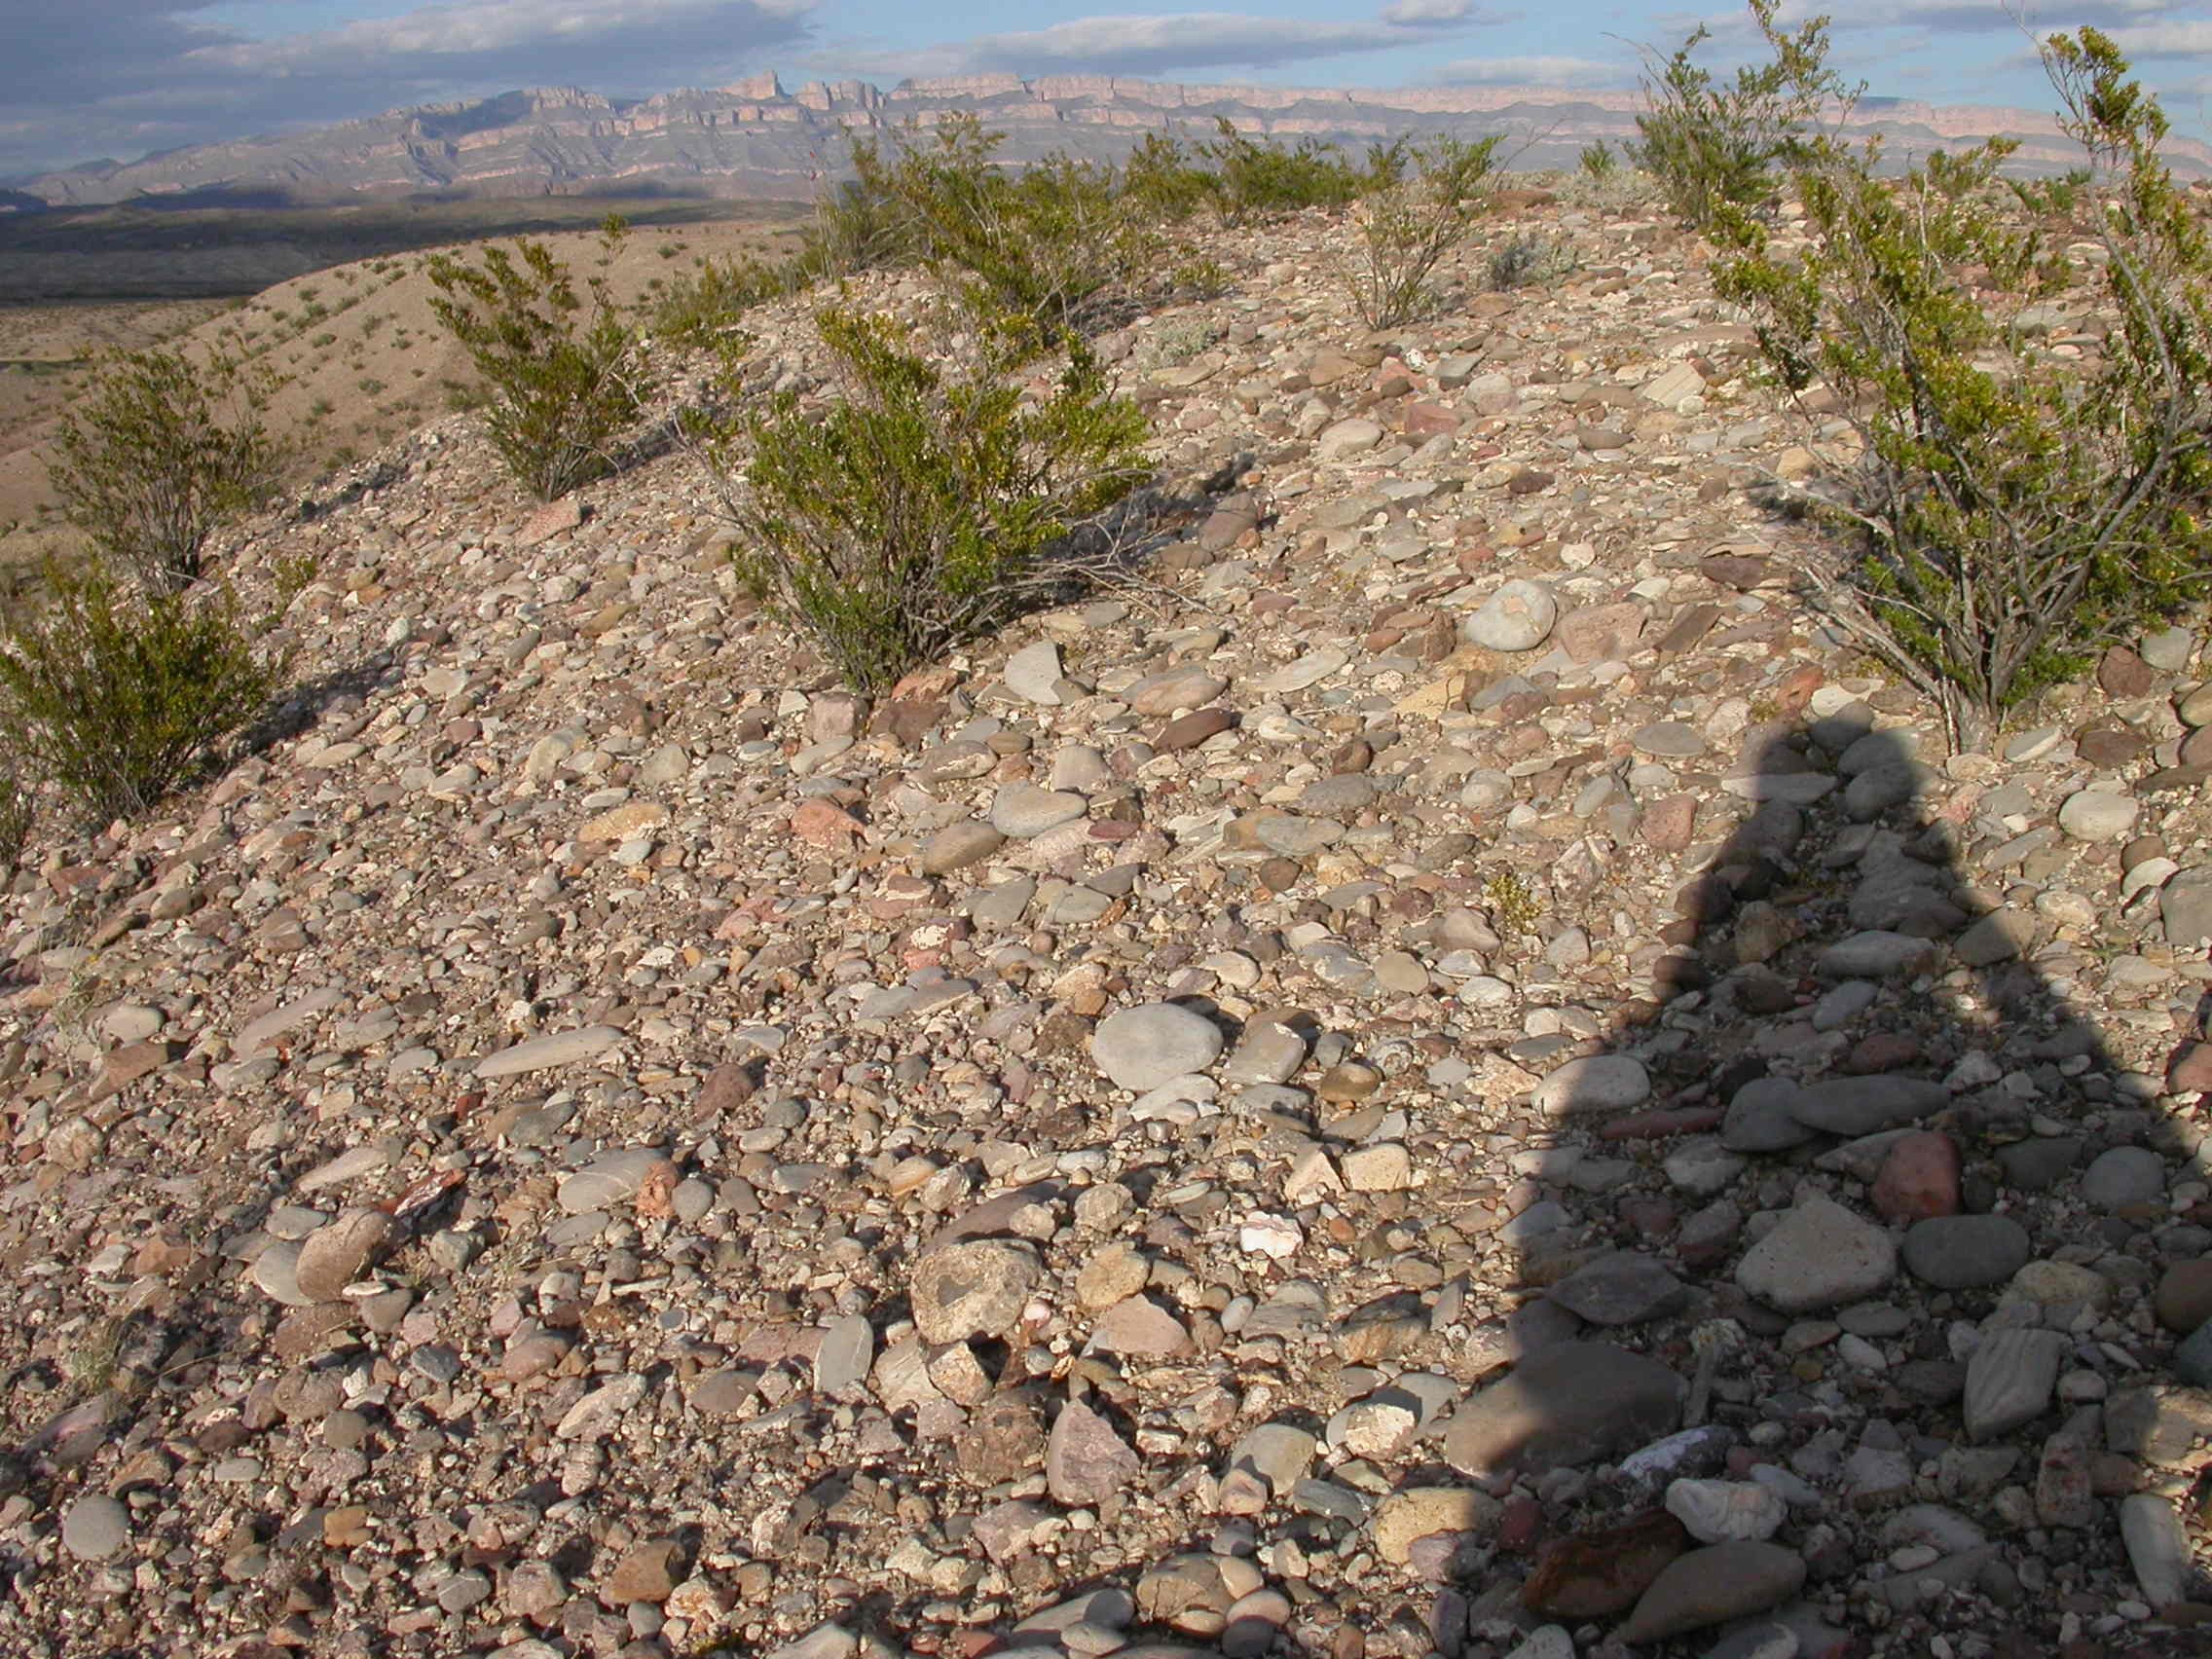
Margaret’s shadow atop a river terrace, Big Bend National Park
This photo (left) is one I took during my favorite project to date in Big Bend National Park, Texas. For the project I helped make a new geologic map for the park. I was responsible for mapping the surficial deposits, which included sediments deposited during the late Tertiary (approximately 23 to 2.5 million years ago) and Quaternary (about 2.5 million years ago to the present) time periods.
That’s me (or at least my shadow) taking a photograph of old river-terrace gravels deposited by the Rio Grande. The terrace, now high above the river, was formed when the river cut its channel to lower elevations. This was my favorite mapping project because it provided an opportunity to work in an area with exceptional beauty, intriguing geology, and a rich cultural history.
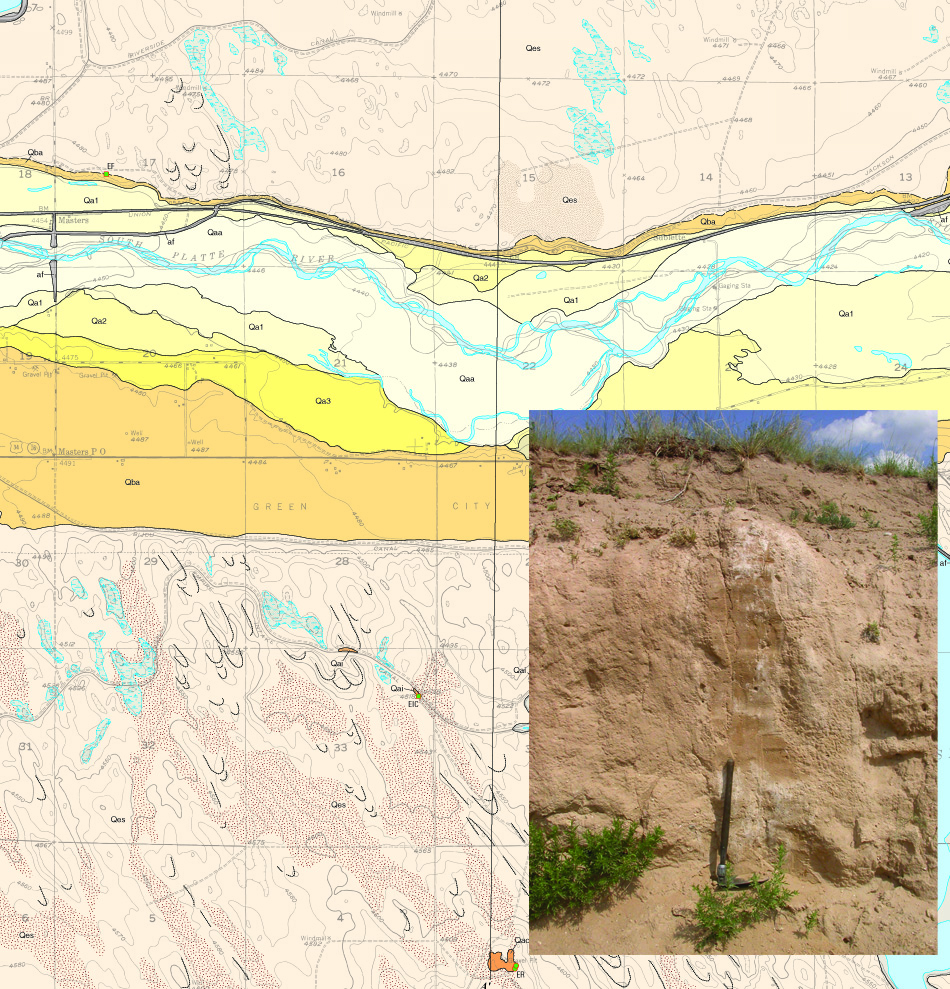
Geologic map of the Masters, Colorado quadrangle and field photo (click to enlarge in new tab)
This map (right) is part of a recently published geologic map of the Masters, Colorado 7.5′ quadrangle, available at http://dx.doi.org/10.3133/sim3344. The map features the South Platte River floodplain, several levels of river terraces, and large expanses of sand dunes of varying age (see inset photograph). The youngest sand dunes (visible in the upper half meter of outcrop) were active around one thousand years ago. The underlying sands are much older and indicate an earlier time when blowing sand formed dunes on the landscape.
You can follow Margaret’s work as well as other USGS progress on Twitter at @USGS and @USGSTNM (The National Map) or on Facebook: https://www.facebook.com/USGeologicalSurvey/